【matplotlib基础】--子图
使用Matplotlib对分析结果可视化时,比较各类分析结果是常见的场景。
在这类场景之下,将多个分析结果绘制在一张图上,可以帮助用户方便地组合和分析多个数据集,提高数据可视化的效率和准确性。
本篇介绍Matplotlib绘制子图的常用方式和技巧。
1. 添加子图的方式
添加子图主要有两种方式,
一种是函数式风格:(也就是上一篇画布中介绍的方式)
import numpy as np

import matplotlib
import matplotlib.pyplot as plt

%matplotlib inline

x = np.array(range(0, 8))

fig = plt.figure(figsize=[6,4])
fig.add_subplot(211) # 2行1列的第一个
y = np.random.randint(1, 100, 8)
plt.plot(x, y)

fig.add_subplot(212) # 2行1列的第二个
y = np.random.randint(1, 100, 8)
plt.plot(x, y)

另一种是面向对象风格:(使用 Axes 对象)
x = np.array(range(0, 8))

fig, ax = plt.subplots(1, 2)  # 设置子图1行2列
y = np.random.randint(1, 100, 8)
ax[0].plot(x, y)

y = np.random.randint(1, 100, 8)
ax[1].plot(x, y)
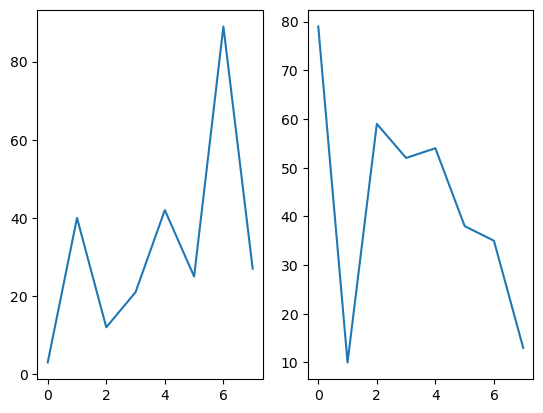
上面设置好子图的布局之后,添加子图的顺序是从上到下,从左到右。
2. 子图的布局
子图的布局是按照行列设置的,设置之后,相应的位置可以添加子图。
x = np.array(range(0, 8))
rows, cols = 2, 2  # 2行2列,4个子图
fig, ax = plt.subplots(rows, cols)

for i in range(rows):
    for j in range(cols):
        y = np.random.randint(1, 100, 8)
        ax[i, j].plot(x, y) # i,j定位子图的位置
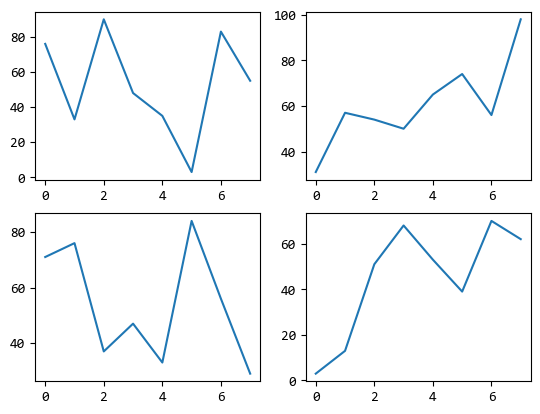
子图按照网格布局时,我们看到上面4个子图的Y轴刻度不一样,这样不利于比较。
x = np.array(range(0, 8))
rows, cols = 2, 2  # 2行2列,4个子图
fig, ax = plt.subplots(rows, cols, sharey='all')

for i in range(rows):
    for j in range(cols):
        y = np.random.randint(1, 100, 8)
        ax[i, j].plot(x, y) # i,j定位子图的位置

设置
sharey='all'之后,Y轴刻度保持一致,这样比较曲线才有意义。上面的示例中 X轴刻度是一致的,如果不一致,可以用
sharex 属性来设置。
3. 复杂的布局
3.1. 不规则的网格
除了规则的网格布局,还可以通过 GridSpec 设置不规则的网格。
比如:
rows, cols = 3, 3
grid = plt.GridSpec(rows, cols)

plt.subplot(grid[0, :2])
plt.subplot(grid[0, 2])

plt.subplot(grid[1, 0])
plt.subplot(grid[1, 1:])

plt.subplot(grid[2, :])

上例中设置了3行3列的网格,但是不是每个图形占用几个网格是可以调整的。
3.2. 嵌套图形
除了网格,还可以通过相对定位的方式来绘制多个子图。
fig = plt.figure()

fig.add_axes([0.1, 0.1, 1, 1])
fig.add_axes([0.3, 0.3, 0.3, 0.3])
fig.add_axes([0.7, 0.6, 0.3, 0.2])

上面按相对位置添加子图的函数
add_axes的参数是一个4元列表。这个列表4个元素的含义:
- 第一个元素表示子图左下角距离画布左边的距离占画布总宽度的比例
- 第二个元素表示子图左下角距离画布底边的距离占画布总高度的比例
- 第三个元素表示子图宽度占画布总宽度的比例
- 第三个元素表示子图高度占画布总高度的比例
注意,这里的4个值都是比例。
4. 总结回顾
Matplotlib 中的每个子图可以有自己的标签、大小、位置和样式,可以方便地组合成一个复杂的图形。
我们一般在下列场景中使用子图:
- 数据可视化:将多个数据集在同一张图中显示,进行对比和分析。
- 图表组合:将多个图表组合在一起,形成一个综合性的图形。
- 数据分析:将多个数据集在同一张图中显示,进行筛选和筛选。
- 可视化规范化:将多个来源不同的数据集在同一张图中显示,保证图形的一致性和准确性。
热门相关:我有一座冒险屋 不科学御兽 异世修真邪君 后福 豪门情变,渣总裁滚远点!