【pandas小技巧】--DataFrame的显示参数
我们在jupyter notebook中使用pandas显示DataFrame的数据时,
由于屏幕大小,或者数据量大小的原因,常常会觉得显示出来的表格不是特别符合预期。
这时,就需要调整pandas显示DataFrame的方式。pandas为我们提供了很多调整显示方式的参数,具体参见文末附录中的链接。
本篇介绍几个我经常用到的参数来抛砖引玉。
1. 参数的相关函数
对于参数的控制,pandas提供了完整的方法。
- describe_option:获取参数的描述信息
- get_option:获取参数的值
- set_option:设置参数的值
- reset_option:重置参数的值,也就是将参数恢复到默认值
以 max_columns(显示最大的列数)为例,演示上面各个函数的使用:
import pandas as pd

pd.describe_option("display.max_columns")

这里显示了
max_columns参数的详细信息,包括默认值和当前的值。
我们先设置此参数的值,然后再获取值看看:
pd.set_option("display.max_columns", 10)
pd.get_option("display.max_columns")

 # 运行结果>>>
 # 10
max_columns参数的值变成了10。
最后重置此参数的值:
pd.reset_option("display.max_columns")
pd.get_option("display.max_columns")

 # 运行结果>>>
 # 20
max_columns参数的值又恢复成了20。
上面这4个函数是我们设置参数的过程进程会用到的,
下面演示几个常用参数的设置后的效果。
2. 行列相关的参数
控制行列相关的参数,多数情况是为了让数据能够更好的显示在屏幕上。
我比较常用的有以下三个:
2.1. max_rows
控制显示的最大行数。
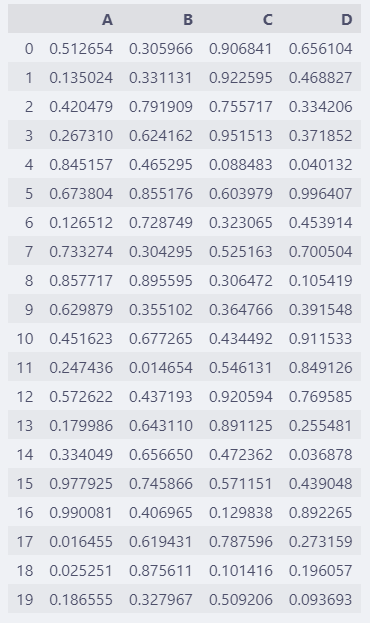
随机生成一个20行的数据,max_rows的默认值是60,所以20行数据会全部显示出来。
df = pd.DataFrame(np.random.rand(20, 4))
df.columns = list("ABCD")
df
如果需要截一个数据概要的图,20行就太多了,可以设置显示的函数少一些。
pd.set_option("display.max_rows", 10)
df

设置之后,显示前后
5行,中间的用省略号(...)表示。
2.2. max_columns
这个参数是控制显示的最大列数。
df = pd.DataFrame(np.random.rand(5, 14))
df.columns = list("ABCDEFGHIJKLMN")
df

显示很长,屏幕窄的话会出现滚动条。
设置 max_columns=5
pd.set_option("display.max_columns", 5)
df

2.3. max_colwidth
这个参数是设置单个列的宽度的,如果某个列的内容太长,可以用这个参数来控制。
比如:
df = pd.DataFrame({
    "ID": [1, 2, 3 ],
    "title": ["title01", "title02",
              "long long long long long title"],
})
df

某个特别长的值会将列的宽度撑大,如果列比价多的时候,会浪费显示的空间。
通过 max_colwidth 调整列的最大宽度。
pd.set_option("display.max_colwidth", 10)
df

设置最多显示
10个字符,这样,显示起来没有那么突兀了。
3. 数值精度的参数
除了行列的调整,还有一种就是数值精度的调整。
数值精度的调整有个好处是不用修改原始数据,只是控制它显示出来的样子。
3.1. precision
precision是调整数据显示的精度的参数。
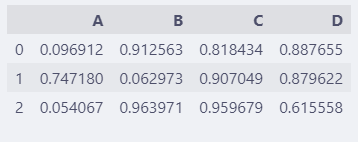
调整前:
df = pd.DataFrame(np.random.rand(3, 4))
df.columns = list("ABCD")
df
调整后:
pd.set_option("display.precision", 2)
df

3.2. float_format
float_format也是调整精度的,不过更加灵活,还可以控制格式化显示效果。
调整前:
df = pd.DataFrame(np.random.rand(3, 4))
df.columns = list("ABCD")
df

调整后:
pd.set_option("display.float_format",
              "{:.2%}".format)
df
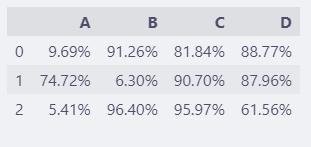
直接转换成百分比方式显示,比
precision更加直观。
3.3. chop_threshold
chop_threshold 帮助我们在显示时忽略掉不关注的数据。
比如:
df = pd.DataFrame(np.random.rand(3, 4))
df.columns = list("ABCD")
df

对于0.9以下的数据,我们不太关心,那么:
pd.set_option("display.chop_threshold", 0.9)
df

这样,
0.9以下的数据都显示成0,便于我们观察有多少有效数据。
注意:这里调整的都是数据显示出来的样子,数据实际并没有改变。
比如上面很多显示为 0.0 的数据,在 df 中并不是0.0,还是原来的值。
4. 补充
pandas中能够调整参数还有很多,具体可以参考:
https://pandas.pydata.org/pandas-docs/version/1.5/reference/api/pandas.describe_option.html